Stock Market Indicator Charts
Many new traders spend coutnless hours trying to find the magic combo of Stock Market Indicators on charts. But can you really find the holy grail using this method? The anger is yes and no, let me explain how:
Market Indicators will show you things that the naked eye can't see on charts. They allow you to confirm market moves such as moving average crossovers, ADX, RSI, MACD and many more. Is there a magic formula for mixing them together with different data time frames?
No. There is no magic formula you can use with these indicators to mix and match your way to endless riches. I personally have tested hundreds of thousands of combos with a program from StrataSearch without success. But don't give up, and I'll explain why you should continue your quest for YOUR stock market holy grail trading system.
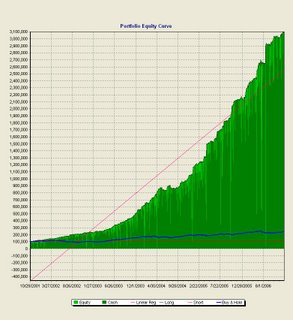
If you use a few technical indicators with strict money management rules, it is possible to be the stock market year after year. What proof do I have that this will work? Well check out the screenshots of my trading system:
 This system in a 5 year period would take 100,000 dollars to 3,100,000. How about that for some results. This system compounded by the tune of 98% annually. Well this is fine and all, but look at the Drawdown:
Notice how the maximum drawdown is less then 10% so why is this so important. Because for each 10% you are down, you need to make 11% to make you 10 back. This is why using risk to manage your money is the most powerful part of the system.

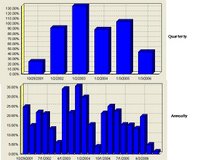
But how did it to during this 5 year period? You can see the results of Quarterly and Yearly. There was not 1 year down or Quarter. So during this tough markets of 2000-2003 when the S&P 500 lost 60% of their money, this system was making money hand over fist.
This system actually does BETTER during a bull market, so that is the scary part. So please don't give up on your system and feel free to contact me for advice on how to improve your system.

0 Comments:
Post a Comment
<< Home